Here’s How Our System Saw Energy’s Breakout Coming
Once again, the calculus has changed in the Middle East conflict…
Over the weekend, Iran directly attacked Israel. It launched more than 300 missiles and drones.
Israel and its partners claim to have shot most of them down. And now, all sides are considering their “next steps.”
It’s a tense moment. And it’s one that will eventually play out in the energy markets.
After all, just about every mention of instability in the Middle East adjusts the price of oil… even if it’s not directly related to the oil markets.
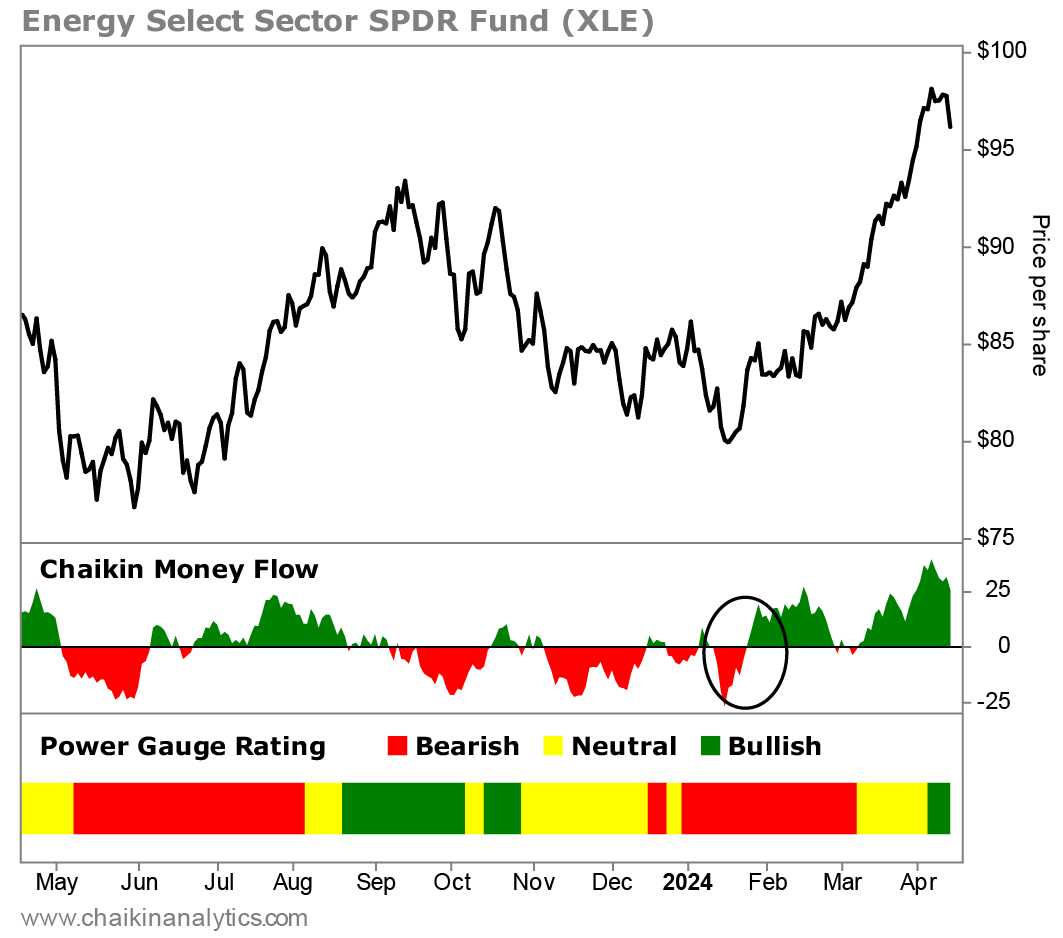
But the energy sector has already been on the move this year. On Friday, the Energy Select Sector SPDR Fund (XLE) quietly touched a nine-year high during intraday trading.
That’s not all…
XLE has been soaring in recent weeks. It’s up 13.6% since the start of the year. That’s more than double the S&P 500 Index’s gain of 6.1% in 2024 so far.
This performance is even more impressive when we consider the rough start for energy stocks this year…
Now, let’s take a look at how the Power Gauge saw this coming. We’ll also discuss what it means for the energy sector going forward…
XLE underperformed the market in January. It finished the month down 0.5%. That’s an ugly result compared with the 1.6% gain for the S&P 500.
And if we look at our Chaikin Money Flow indicator, we can see why XLE struggled…
As regular readers know, Chaikin Analytics founder Marc Chaikin created this indicator to measure the accumulation (buying pressure) versus distribution (selling pressure) of a stock over time.
Chaikin Money Flow can be a good way to identify the behavior of large institutional investors without directly tracking their order flow. This is because large institutions are disproportionately responsible for a “closing effect” on price.
Put simply, the Chaikin Money Flow indicator helps us measure “smart money” trading.
In the case of XLE, I’ve circled the most important spot to focus on for Chaikin Money Flow in the chart below…
Notice the big red dip in the indicator in late January. That tells us that institutional investors were dumping energy stocks.
We can also see that the selling ended in early February. The Chaikin Money Flow indicator flipped from red to green. And it stayed green for weeks – even as XLE traded sideways heading into March…
March turned out to be a huge month for XLE. The fund surged 9.6%. That was more than triple the S&P 500’s 3.1% gain.
There are two key takeaways here…
First, it shows why the Power Gauge is such a valuable tool for spotting a trend change before it happens.
In this case, energy stocks started 2024 in a downtrend. But our Chaikin Money Flow indicator started flashing green in February – before the big gains in March.
In other words, the Power Gauge gave us an early signal that energy stocks were turning around.
The second important takeaway is that XLE is in a confirmed uptrend.
For the first time since late October, the Power Gauge gives the fund a “bullish” rating.
As I mentioned earlier, the fund tripled the S&P 500’s performance in March. And so far in April, it’s up 0.9% while the S&P 500 is down 3.7%.
So, if you’re not paying attention to the energy sector now… I recommend you do so.
Good investing,
Vic Lederman