Chaikin Money Flow
What is Chaikin Money Flow (CMF Indicator)?

A Quick Overview
Chaikin Money Flow (the CMF Indicator) was created by Marc Chaikin in the early 1980s as a way to measure the accumulation (buying pressure) vs. distribution (selling pressure) of a stock over time.
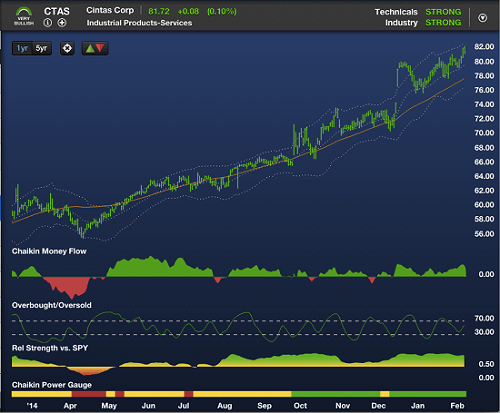
Chaikin Money Flow is displayed as a green/red oscillator around a 0-line, ranging from +100 to -100, with green regions representing net buying pressure, and red regions representing net selling pressure.
Because of the way the calculation was designed, money flow persistency (significant regions of green or red over a 6-9 month period), can be signs of accumulation or distribution by major institutions which have a disproportionate effect on future price movement.
This is true even though the calculation looks only at price/volume activity, rather than directly monitoring institutional order flow.
A short-term money flow divergence —where price rises but Money Flow stays negative, or vice versa—can indicate an increased risk of a short-term reversal.
The Formula
The formula for the daily Chaikin Money Flow value is:
((((Close – Low) – (High – Close)) / (High – Low)) * Volume) / Total(Volume, 21)
The value ranges from +100 to -100, reflecting a stock’s volume-weighted
closing performance over a one month (21-day) period
Understanding Chaikin Money Flow
Not all price moves are created equal—a stock may go up while “hitting its head on the ceiling” or “bouncing off the floor.”
Chaikin Money Flow looks “inside” a stock’s trading activity to distinguish price movements which are likely to be supportable based on price/volume patterns, from those which are not. Chaikin Money Flow looks at two important factors to determine the likely sustainability of a price move:
- Has the stock been closing strong during this move?
- Has the move happened on relatively high or low volume?
Buying pressure is represented by stocks which have been closing high in their daily range, on high volume. Selling pressure is represented by stocks which have been closing low in their daily range on high volume.
Closing Performance
In the first case, we look at closing performance—where a stock closes in its range for the day—this determines the direction of daily Money Flow.
A rising stock which regains its footing to close strong over time is more likely to continue its upward move.
Stock A
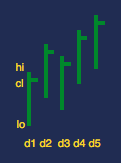
Strong closing performance
Stock B
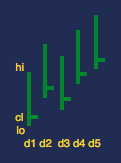
Weak closing performance
In both cases, the stock’s Closing Price has moved up the same amount. However the Stock A rallied to close near its daily high each day, contributing to positive Money Flow, while Stock B dipped to close near its low each day, contributing to negative Money Flow.
Volume Confirmation
Next we look at the effect of volume, which will determine the magnitude of daily Money Flow.
Performance on higher-volume days is a truer indication of what market participants are willing to pay for a stock
Stock A
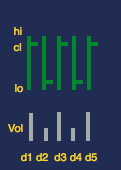
Closing strong on high volume
Stock B
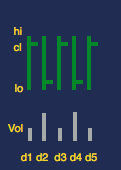
Closing weak on high volume
In this example, both stocks alternate between closing strong and closing weak. However, Stock A closed strong on high-volume days, contributing to positive Money Flow, while Stock B closed weak on high-volume days, contributing to negative Money Flow.
The daily Money Flow calculation combines closing performance and volume confirmation to determine the magnitude and direction of buying or selling pressure.
How to Use Chaikin Money Flow
Chaikin Money Flow can be an input into both the stock selection and timing considerations.
Money Flow Persistency
When identifying buy candidates, look for evidence of strong money flow persistency, meaning significant regions of green over the last 6-9 months.
The primary input into your stock selection process should be a stock’s Chaikin Power Gauge rating and its recent history. However, backtesting has shown better historical performance from Bullish stocks when confirmed by strong money flow persistency.
It should not be a “deal-breaker” if a stock has some regions of red, but prefer stocks with strong Money Flow Persistency when possible.
Conversely, weak money flow persistency can confirm a Bearish rating.
Money Flow Persistency is one of the 20 factors ranked in the Chaikin Power Gauge Rating model.
Money Flow Divergence
A money flow divergence occurs when a price move is not accompanied by a similar change in Money Flow.
A negative money flow divergence can be an important indication of potential short-term risk, or help identify potential short candidates when choosing among Bearish stocks, especially when combined with a Chaikin Sell Signal, such as an Overbought Sell.
Generally, Money Flow should correlate with price movement over time – as price goes up, money flow should, on average, get more green, and as the closing price goes down over time, money flow should get more red. So if a stock has a short-term rally while Money Flow stays positive, this is confirms the move and doesn’t necessarily add any information.
But if a stock has a short-term rally, say from near its lower Chaikin band to near its upper Chaikin band, and Money Flow stays noticeably red, this indicates a higher likelihood of a pullback.
Relation to Institutional Activity
Chaikin Money Flow can be a good way to identify the behavior of large institutional investors – such as pension funds, mutual funds, and hedge funds – without directly tracking their order flow. This is because large institutions are disproportionately responsible for a “closing effect” on price.
To understand why, envision the behavior of a traditional fund management company:
- The Research Department determines the firm’s overall orientation on specific stocks, deciding which they should be long or short, and in what rough proportions.
- Portfolio Managers make decisions on allocations for specific funds or portfolios.
- They communicate instructions to a Trading Desk, whose job it is to manage specific Buy and Sell orders to minimize market impact.
Early in a trading session, Traders will be less likely to expose large blocks of shares to trade, which can move the market against them. As the session nears its close, however, traders need to be more aggressive in getting their orders filled, bidding stocks higher if they are buying, or accepting lower offers if they are selling—thus creating a subtle but noticeable “closing effect,” which is more present than with retail order flow.
Chaikin Money Flow is effective in measuring this effect, helping indicate the “true” buying and selling pressure of the institutions who most move markets.
In Conclusion
Chaikin Money Flow can be an important stock selection and timing tool. It should be used in conjunction with the Chaikin Power Gauge Rating, Industry Rating and other technicals such as trend performance and Relative Strength. Confirm a Bullish rating with strong Money Flow persistency when possible, and consider stocks with noticeable short-term Money Flow divergences to be at higher risk for short-term pullbacks.
Other services such as Investors Business Daily have had access to Chaikin Money Flow for years and it has become a standard way of measuring accumulation and distribution. Chaikin Analytics is the first system that displays it for maximum effect, combined with the other indicators necessary to support a broad-based Buy/Sell decision.