A One-Of-A-Kind System That Predicts the Future Behavior of Stocks & ETFS

If you aren’t familiar, the Power Gauge rating system is the culmination of Marc Chaikin’s 50 year career on Wall Street… where he worked with some of the most prestigious hedge funds in history, run by the likes of Steve Cohen, Michael Steinhardt, Paul Tudor Jones, and George Soros.
He built the system to scan the market each trading day, and issue a Bullish, Neutral, or Bearish rating on over 5,000 stocks and 2,300 ETFs.
It’s a one-of-a-kind system that predicts the future behavior of stocks and ETFs – based on the same stock-rating system Marc helped design for professional investors, traders, and analysts over decades.

A Way to Pick Up on Wall Street Signals
You Can't See on a Chart
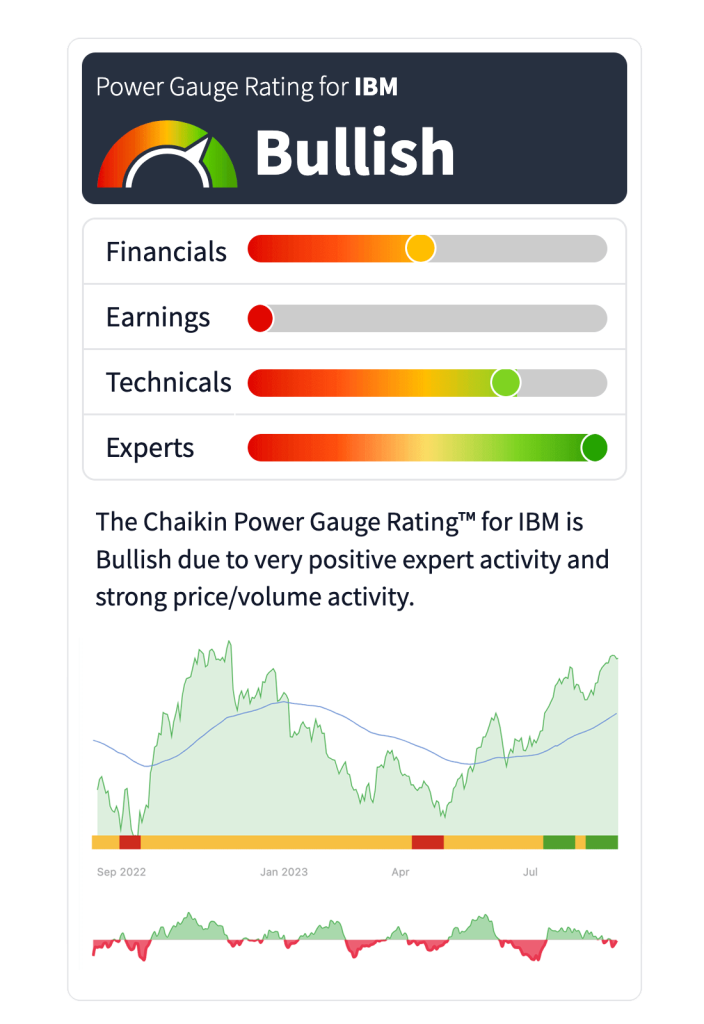
The Chaikin Power Gauge rating is the centerpiece of everything we do — It picks up on signals you could never see simply looking at technical charts.
The rating ranges from Very Bearish (likely to underperform) to Very Bullish (likely to outperform).

The stock rating combines twenty of the most important factors that can impact price movement… and distills them down into a simple, reliable prediction of future performance.
The system is supported by over ten years of independent backtesting and successful real-world performance since 2011.
The ETF rating combines the proprietary stock rating model with technical analysis factors to predict an ETFs potential.
"I've known Marc Chaikin for a long time. He is one of the most creative and insightful analysts that I have had the pleasure to work with. His willingness to cross disciplines makes his work particularly interesting and useful and he is still raising the bar when most analysts at his career stage are resting on their laurels."
Decades of Knowledge Packed Into A Powerful System
During Marc Chaikin’s career, it was evident to him that Wall Street had a clear advantage over individuals. They had all the information at their fingertips… Teams of analysts at their every beck and call… and the best and brightest to spearhead their research.
They had the complete story for each and every company and individuals simply did not… That all changed with the Power Gauge.
It accounts for a company’s fundamentals AND technicals…
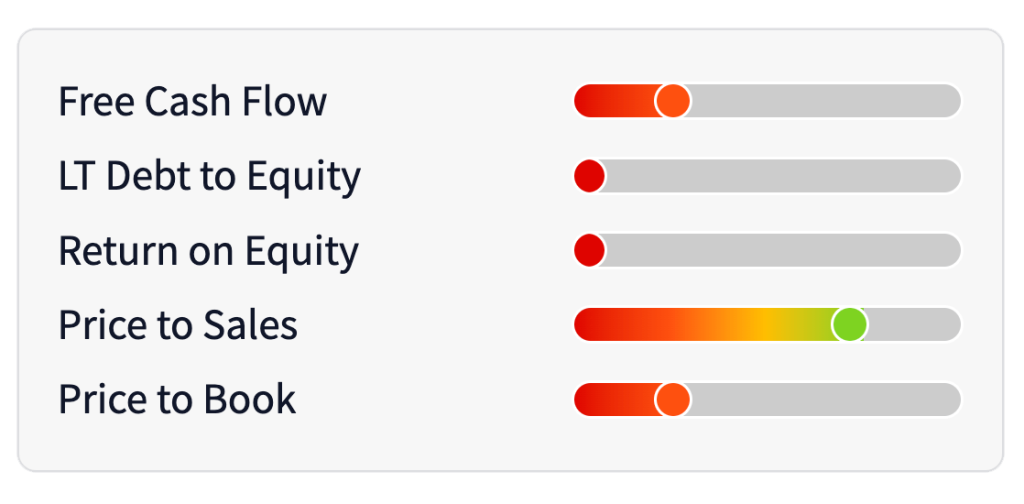
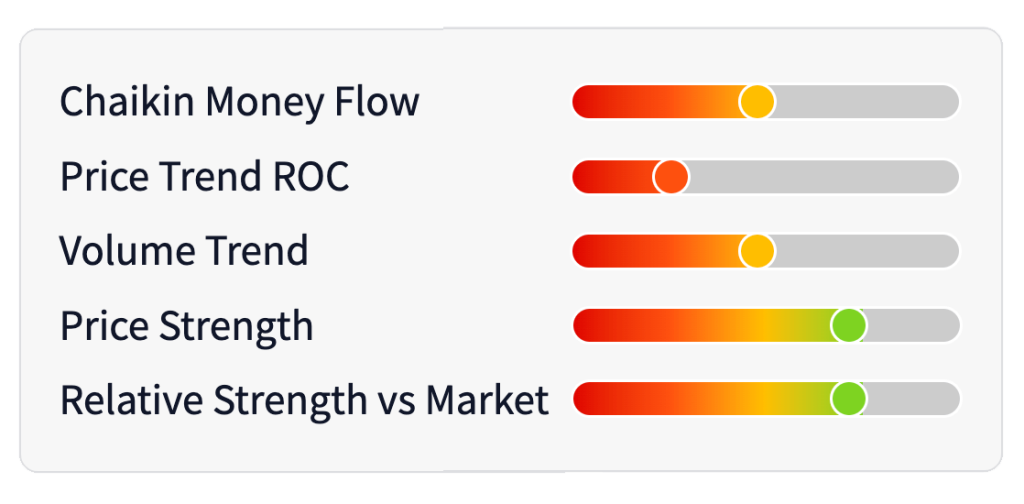
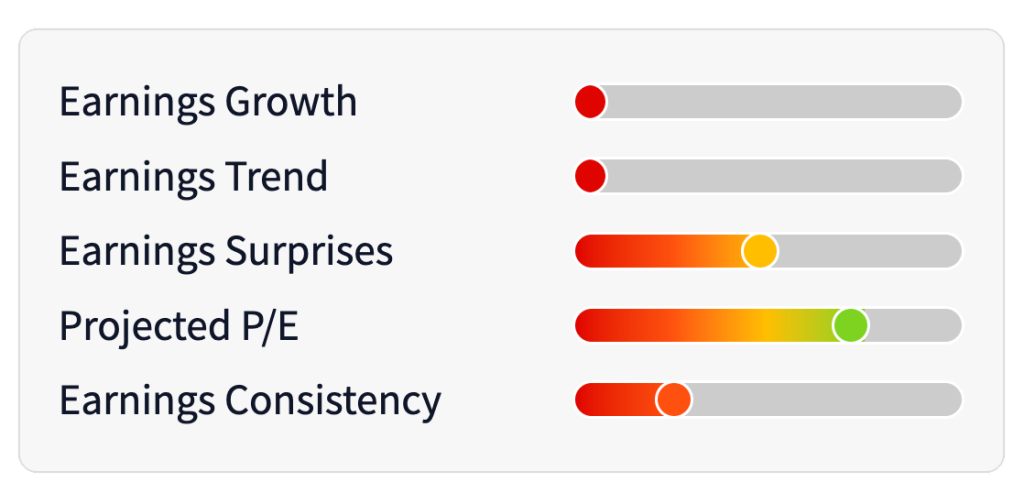
Here are the 20 factors of the power gauge rating explained in detail:
Financials:
Technicals:
Earnings:
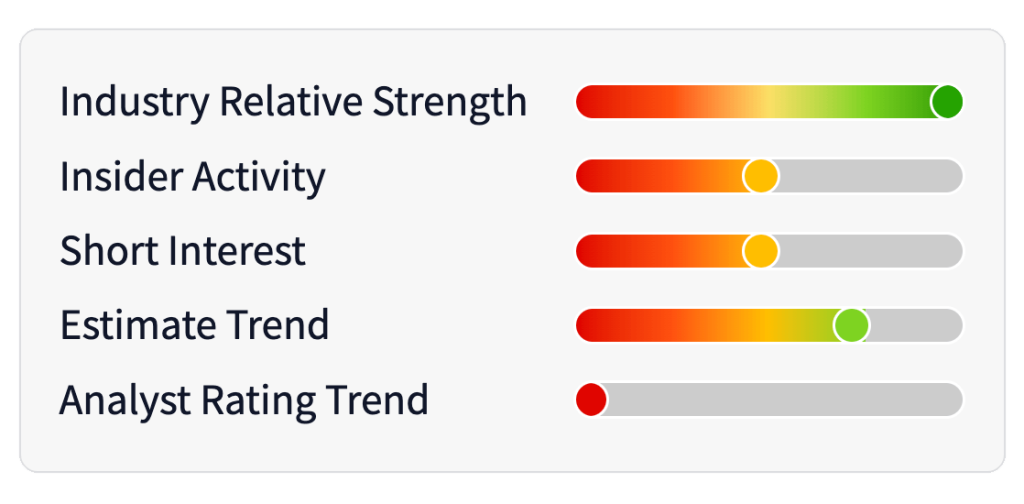
Experts:
Over the years, Marc learned which factors the “smart money” pays close attention to before making any buy or sell decision. He took those factors… and put them into the Power Gauge system.
On Wall Street, it’s common knowledge that fundamentals tell you what is considered a “good buy” and the tell you when the best time may be.. But no one should be 100% committed to a fundamental OR technical approach… and that’s what makes the Power Gauge system so special.
The Power Gauge rating accounts for fundamentals and technicals.
Tap Into Chaikin's Powerful Perspective
Over 1,000,000 people have signed up to get our Chaikin PowerFeed newsletter… Sign up now and each trading day, Marc Chaikin and his team will provide you with unique insights from the Power Gauge system.
Delivered to your e-mail Monday through Friday — 100% FREE.
By entering your email, you agree to subscribe to Chaikin PowerFeed, and will begin receiving occasional marketing messages. You can unsubscribe at any time. Read our privacy policy here.